Disclosure: I am long BRK.B, GS. I wrote this article myself, and it expresses my own opinions. I am not receiving compensation for it. I have no business relationship with any company whose stock is mentioned in this article.
One of the long term investing methods that I employ is to find stocks that continually increase their book value per share (or tangible book value per share) over an extended period of time (years or decades). While screening for these companies, I allow small year over year declines (in the 20% or less region) assuming that this does not consistently happen. In general, the book value should be increasing year in and year out. I also rule out any companies that have a single occurrence of a large year over year decline in their book value. Needless to say, this becomes a very small list of companies.
Once a company passes this screen, a model is built to define an upper and lower valuation trend line based on historical price to book ratios. This is a must. If one buys great companies at historical high valuations, it can be decades before he or she might see a gain on this purchase. Needless to say, buying at an attractive valuation is very, very important. It is highly important to know what your downside risk in the stock may be after your purchase, and the lower valuation trend line is helpful in this regard. You must be comfortable holding the stock at your purchase price if the market temporarily heads lower, and your stock trades down to the lower valuation trend line. Knowing this ahead of the time may help one to hold the security during a rough patch in the market and not get "scared out" at an inopportune time.
After this, the third step in the process is to use technical analysis to aid in the actual entry level. This can be when a stock trades down to a former support level or is breaking out of resistance levels.
I have identified four companies that appear to have very nice entry levels based on this method. I will present two of them below, and I will have a follow up article for the other two.
The first company is Goldman Sachs (GS).
The last time that Goldman Sachs had a decrease in its tangible book value per share was in 2007 and it was a decrease of 15%. Goldman has a nice record of increasing its tangible book value per share year in and year out. Even during the great recession of the last few years, Goldman has been rock solid. See the graph below that illustrates this.
(click to enlarge)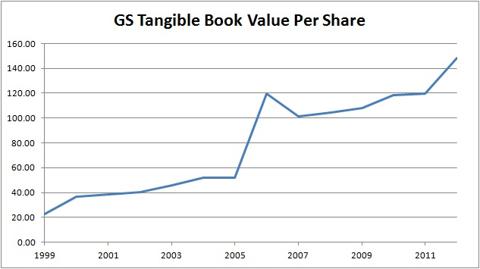
Figure 1: GS Tangible Book Value Per Share
Next, we'll look at the upper and lower valuation trend lines based on historical tangible book value per share.
(click to enlarge)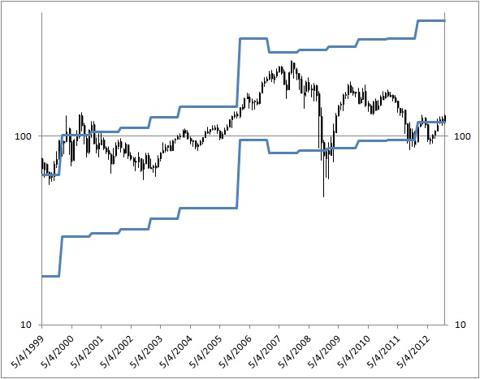
Figure 2: GS Historical Price with Upper and Lower Valuation Trend Lines
The lower valuation trend line is set to be approximately 0.8 times tangible book value. This would set a lower valuation for GS of approximately $118.50 per share. With the stock trading at the $128 level, this gives downside of only 7.5% with a tremendous amount of upside based on historical valuations.
The chart for GS currently points to a very good entry level as well. It has had a breakout of a cup with handle pattern near the $126 level. The chart can also be viewed as a major double bottom with a break out level of approximately $128.
(click to enlarge)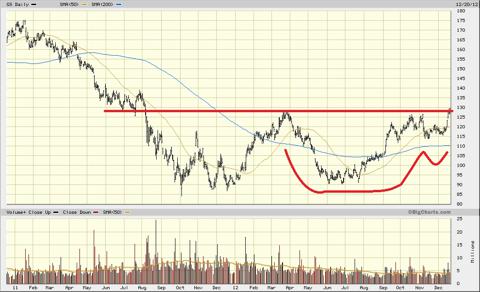
Figure 3: GS Two Year Price Chart
Based on all the criteria presented above, Goldman Sachs seems to be presenting a very good long term risk/reward entry level for patient long term investors.
The second company is Berkshire Hathaway, (BRK.A and BRK.B).
In the last twenty years, Berkshire has only had a book value decrease of 6.25% in 2001 and 9.5% in 2008, quite an impressive record. See the graph below that illustrates this.
(click to enlarge)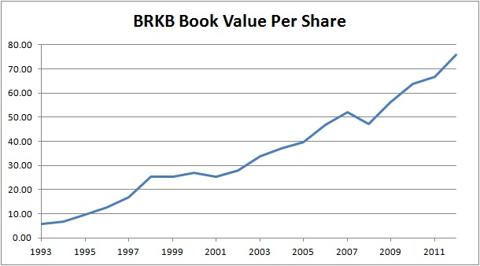
Figure 4: BRKB Book Value Per Share
Next, we will look at the upper and lower valuation trend lines based on historical book value per share.
(click to enlarge)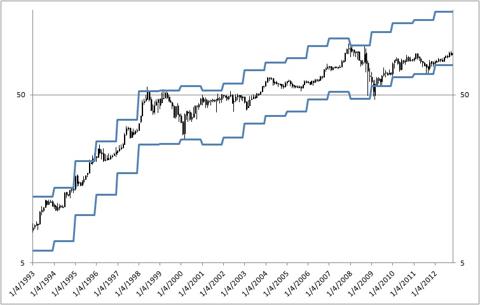
Figure 5: BRKB Historical Price with Upper and Lower Valuation Trend Lines
The lower valuation trend line is set to be approximately 1.0 times book value. This would set a lower valuation for BRKB of approximately $75 per share. With the stock trading at the $128 level, this gives downside of only 16.67% with a tremendous amount of upside based on historical valuations. Also, the company has just announced a stock buyback that can occur at a premium of 20% (increased from 10%) above the book value. This would be in the area where the stock is currently trading. This may put a floor under the stock at the current levels.
Now let's look at the charts. BRKB seems to have broken above resistance at the $86-$88 level. This again is at their just announced stock buyback level. A second level of support seemed to have developed near the older buyback level of $82.
(click to enlarge)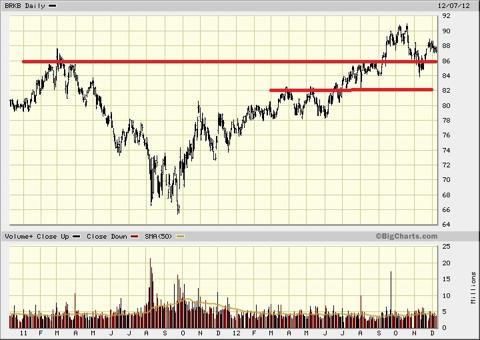
Figure 6: BRKB Two Year Price Chart
Based on all the criteria presented above, Berkshire Hathaway also seems to be presenting a very good long term risk/reward entry level for patient long term investors.
fbi most wanted list stuttering james van der beek dyngus day indonesia quake stephen strasburg shabazz
No comments:
Post a Comment
Note: Only a member of this blog may post a comment.